Data and Results
Data
Table 1: An abbreviated table of the raw data used for this research. Under the "Didymo Presence" column, P= present, A= absent.
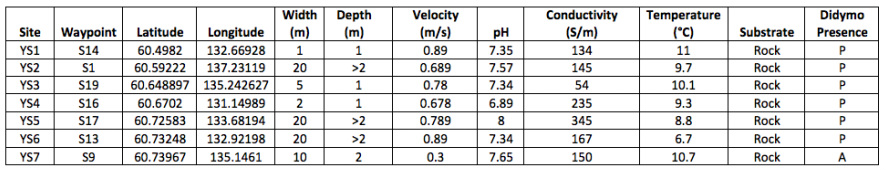
The data table above shows the physical and chemical characteristics of the sampled streams as well the presence/absence of Didymosphenia geminata (i.e. Didymo). The sampling units in this study are the various sites (streams and rivers) sampled in the Yukon. The predictor variables are various chemical and physical characteristics (width, depth, water velocity, temperature and conductivity) of the streams that might have an affect on the distribution of D. geminata. The predictor variables are continuous and are observed. Finally, the response variable is the whether or not D. geminata is present, this is a categorical variable and is also observed.
Exploratory Graphics
Data check
The figure below (Figure 7) showcases the histograms of each of the predictor variables in order to test for normality. Velocity and temperature were fairly normal and did not require any transformations. Width and conductivity both required a log transformation to become normal. pH is extremely skewed due to most of the streams being neutral or more basic, which is to be expected from the geology and soils where the streams are located. A series of transformations were attempted, though none were able to normalize the data (however, I will include it in the statistical analyses anyways).
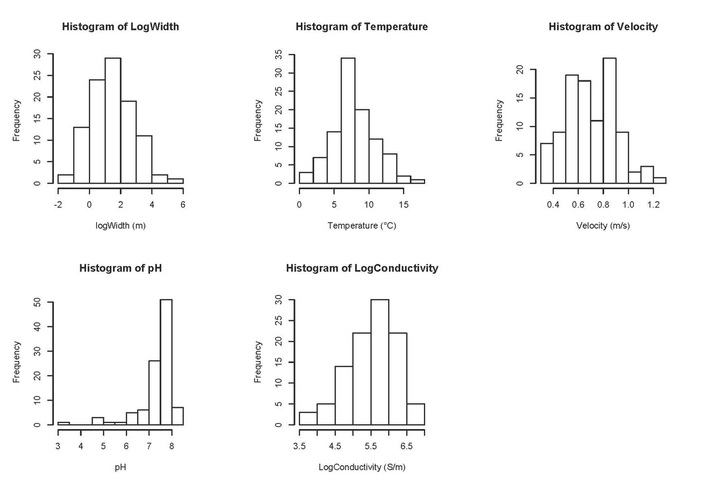
Figure 7: Histograms of the environmental factors (predictor variables) to test for normality. Velocity and temperature were normal and did not require any transformation. Conductivity and width required a log transformation to be normalized. pH was very skewed and no transformation was able to normalize it.
The figure below (Figure 8) shows a preliminary exploration of the relationship between the predictor variables and the response variable. Just by examining the error bars in the various bar plots, it can seen that temperature and water velocity seem to be the most significantly different, however width could possibly be significant as well. Statistical analyses were run in order to test these relationships.
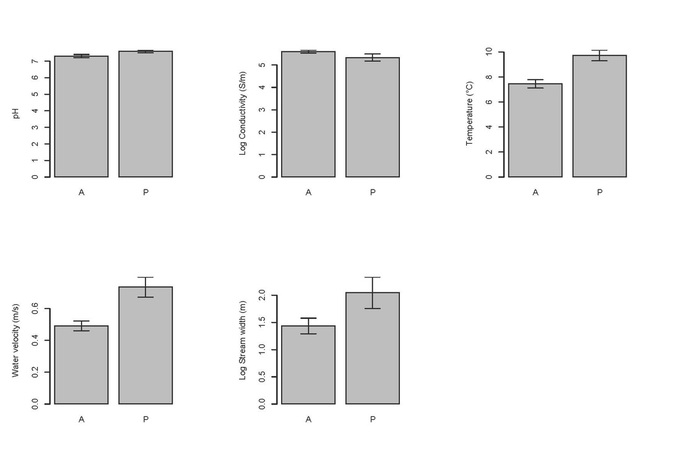
Figure 8: Comparing chemical and physical factors of streams with and without the presence of D. geminata.
Statistical Analysis
Two-tailed t-test
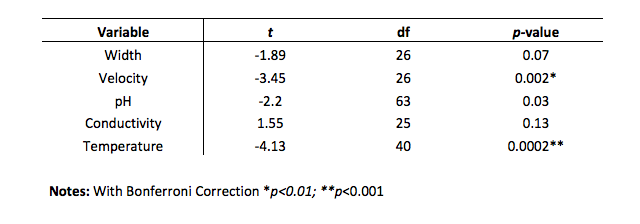
To test if there are significant differences in streams with and without D. geminata with regards to the various environmental characteristics that were measured, a series of two-tailed t-tests were run. Due to the fact that there are multiple comparisons, a Bonferroni Correction was applied to the alpha level, thus the significance level to which the p-values were compared to was 0.01, rather than 0.05. The results from this analysis can be seen in the table below (Table 2).
The results of the t-tests show that water velocity and temperature are both significantly different between sites with and without D. geminata.
The results of the t-tests show that water velocity and temperature are both significantly different between sites with and without D. geminata.
Table 2: Results of the two-tailed t-tests with a Bonferroni Correction between the predictor variables and the response variable (presence/absence of D. geminata.
Logistic Regression
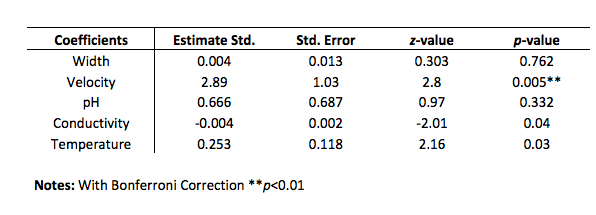
Due to the categorical nature of the data, a logistic regression was run to test the differences between the two types of sites and to compare with the results from the t-tests. A summary of the results from this analysis can be seen in the table below (Table 3). As the logistic regression takes into account the categorical nature of the data by converting them into probability scores, it would be a more powerful statistical analysis in this particular situation. A Bonferroni Correction was also applied to the alpha level, with the alpha level then being 0.01 as well.
Similarly to the t-test, the results of the logistic regression show a significant result with water velocity as well. However, the logistic regression did now show a significant result with temperature, which was seen with the t-test, though when comparing the p-value of temperature with that of the corrected alpha level, it is very close to being significant.
Similarly to the t-test, the results of the logistic regression show a significant result with water velocity as well. However, the logistic regression did now show a significant result with temperature, which was seen with the t-test, though when comparing the p-value of temperature with that of the corrected alpha level, it is very close to being significant.
Table 3: Results of a logistic regression run using the categorical data with the environmental factors as the coefficients.
Density Plots
The figure below (Figure 9) shows the density plots of the raw data for each of the environmental characteristics which were tested for differences between sites with and without D. geminata. These plots were created in order to determine a more specific range of environmental measurements for which D. geminata would not be able to grow in or would require. Due to the large overlap in the curves of Presence and Absence, a more powerful statistical analysis would be difficult, thus I made a qualitative analysis for the difference in measurements of water velocity (due to significant result from both logistic regression and t-test), but also that of water temperature, as it does seem to play a role in driving D. geminata, but to a smaller degree.
By looking at the density plot of water velocity, it seems that D. geminata prefers streams with higher velocities on average (the peak of the green curve (presence) corresponds to a higher velocity (~0.8 m/s) than that of the red curve (absence) which is at ~0.5 m/s). When looking at the density plot of temperature, D. geminata seems to prefer streams with higher water temperatures. The peak of the presence curve corresponds with a temperature of ~10°C with the peak of the absence curve corresponding with a temperature of ~6°C, showing indeed, a smaller difference than that seen in the water velocity plot. When looking at the density plots for the other factors, they all show very similar distributions between sites with and without D. geminata, which supports our results from the statistical analyses which were run.
The significance of these results in a more biological context and what it means for the management of this invasive species will discussed in the "Conclusion" tab.
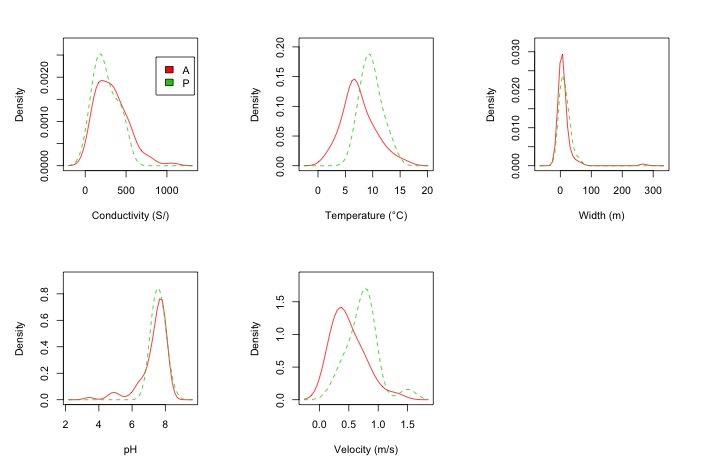
Figure 9: Density plots used to visualize how sites with and without D. geminata differ in terms of their ranges of the environmental characteristics. The green dotted line is for sites with D. geminata present and red line is for sites without D. geminata.
